In the seventh part of this harnessing AI to become a DevOps pro series, I will learn about monitoring and logging. The previous parts of this tutorial series are linked below:
- Version control Systems (VCS)
- Continuous Integration/Continuous Deployment (CI/CD)
- Containerization
- Orchestration
- Infrastructure as Cloud (IaC)
- Cloud Providers
- Monitoring and Logging
- Security
All you need to get started is some basic programming knowledge: to start from the beginning check out the intro guide here.
Follow along each week as we release detailed guides to each of the topics above.
I have mentioned earlier in this series that I have some servers running already. To keep track of these, I mostly just use a built in service from DigitalOcean.
In this part, I will try to find out if there are any better alternatives and hopefully be able to set up something using Docker as well. According to Clio, the most popular tools out there are Prometheus, Grafana and Splunk.
I have not heard about any of these, so all of this will be brand new to me.
What is monitoring and logging used for?
Since this is sort of new territory to me, I will begin by asking for a simple explanation of what this topic is all about.
>>> I want ot learn more about DevOps, and right now I want you to explain a little bit to me about monitoring and logging.

Sure! Monitoring and logging are crucial components of DevOps practices, helping teams ensure the reliability, performance, and security of their applications and infrastructure. Here's a brief overview of each:

### Monitoring

1. Purpose: Monitoring involves continuously observing systems, applications, and infrastructure to ensure they are running smoothly. It helps in identifying issues before they impact users.
2. Types of Monitoring:
• Infrastructure Monitoring: Tracks the health and performance of servers, networks, and other hardware components.
• Application Performance Monitoring (APM): Focuses on the performance and availability of software applications.
• Network Monitoring: Observes network traffic and performance to detect bottlenecks or failures.
• User Experience Monitoring: Measures how real users interact with applications to ensure a positive experience.
3. Tools: Common monitoring tools include Prometheus, Grafana, Nagios, Datadog, and New Relic.
4. Benefits: Monitoring helps in proactive issue detection, capacity planning, and ensuring service level agreements (SLAs) are met.

### Logging

1. Purpose: Logging involves recording events and messages generated by applications and systems. Logs provide a detailed record of what happened and when, which is essential for troubleshooting and auditing.
2. Types of Logs:
• Application Logs: Capture events and errors within an application.
• System Logs: Record operating system events, such as user logins and system errors.
• Security Logs: Track security-related events, such as unauthorized access attempts.
3. Tools: Popular logging tools include ELK Stack (Elasticsearch, Logstash, Kibana), Splunk, Fluentd, and Graylog.
4. Benefits: Logging aids in diagnosing issues, understanding system behavior, and maintaining security compliance.

### Integration in DevOps

• Continuous Feedback: Monitoring and logging provide continuous feedback to development and operations teams, enabling them to make informed decisions and quickly respond to issues.
• Automation: Many DevOps teams automate monitoring and logging processes to ensure consistent and real-time data collection.
• Collaboration: By sharing monitoring and logging data, teams can collaborate more effectively to improve system performance and reliability.

If you have any specific questions or need further details, feel free to ask!
Okay, this was understandable. Here’s a clear explanation for both monitoring and logging. I like that when I ask questions like these, I get an explanation, common tools, benefits, etc. It’s a great way to summarize topics.
Now that I have learned a little bit more about the fundamentals, I want to see if we can get some hands on experience.
Hands-on experience with monitoring
Let’s try to divide this article into two separate parts. One for monitoring and one for logging.
>>> Can you come up with a simple hands-on task that can be used to get an introduction to monitoring? Preferably something with Docker.

Certainly! A simple hands-on task to get introduced to monitoring with Docker involves setting up a basic monitoring stack using Prometheus and Grafana. This task will help you understand how to collect and visualize metrics from a Dockerized application. Here's a step-by-step guide:

### Task: Monitor a Dockerized Application with Prometheus and Grafana

#### Prerequisites

• Docker and Docker Compose installed on your machine.
• Basic understanding of Docker and containerization.

#### Step 1: Set Up a Sample Application

1. Create a simple Node.js application that exposes some metrics. You can use the  express  and  prom-client  libraries to create a basic HTTP server that exposes metrics.
// app.js
const express = require('express');
const client = require('prom-client');

const app = express();
const collectDefaultMetrics = client.collectDefaultMetrics;
collectDefaultMetrics();

app.get('/', (req, res) => {
  res.send('Hello World!');
});

app.get('/metrics', (req, res) => {
  res.set('Content-Type', client.register.contentType);
  res.end(client.register.metrics());
});

const PORT = 3000;
app.listen(PORT, () => {
  console.log(`Server is running on port ${PORT}`);
});

2. Create a Dockerfile to containerize the application.
# Dockerfile
FROM node:14

WORKDIR /usr/src/app

COPY package*.json ./
RUN npm install

COPY . .

EXPOSE 3000
CMD ["node", "app.js"]

3. Build and run the Docker container.
docker build -t node-app .
docker run -d -p 3000:3000 --name node-app node-app


#### Step 2: Set Up Prometheus

1. Create a Prometheus configuration file ( prometheus.yml ) to scrape metrics from the Node.js application.
# prometheus.yml
global:
  scrape_interval: 15s

scrape_configs:
  - job_name: 'node-app'
    static_configs:
      - targets: ['node-app:3000']

2. Create a Docker Compose file to set up Prometheus and Grafana.
# docker-compose.yml
version: '3.7'

services:
  prometheus:
    image: prom/prometheus
    volumes:
      - ./prometheus.yml:/etc/prometheus/prometheus.yml
    ports:
      - "9090:9090"

  grafana:
    image: grafana/grafana
    ports:
      - "3001:3000"

3. Run the monitoring stack.
docker-compose up -d


#### Step 3: Set Up Grafana

1. Access Grafana by navigating to  http://localhost:3001  in your web browser.
2. Add Prometheus as a data source:
• Go to "Configuration" -> "Data Sources".
• Click "Add data source" and select "Prometheus".
• Set the URL to  http://prometheus:9090  and save.
3. Create a dashboard:
• Go to "Create" -> "Dashboard".
• Add a new panel and select a metric from the Node.js application (e.g.,  nodejs_heap_size_total_bytes ).
• Save the dashboard.


#### Conclusion

You now have a basic monitoring setup with Prometheus collecting metrics from a Dockerized Node.js application and Grafana visualizing those metrics. This setup can be expanded by adding more metrics, alerts, and dashboards as you become
more familiar with monitoring.

Feel free to ask if you have any questions or need further assistance!
Nice, this should be a great example for me to go through. Let’s just hope that everything works as expected. I will go through this step by step, and write about the outcome.
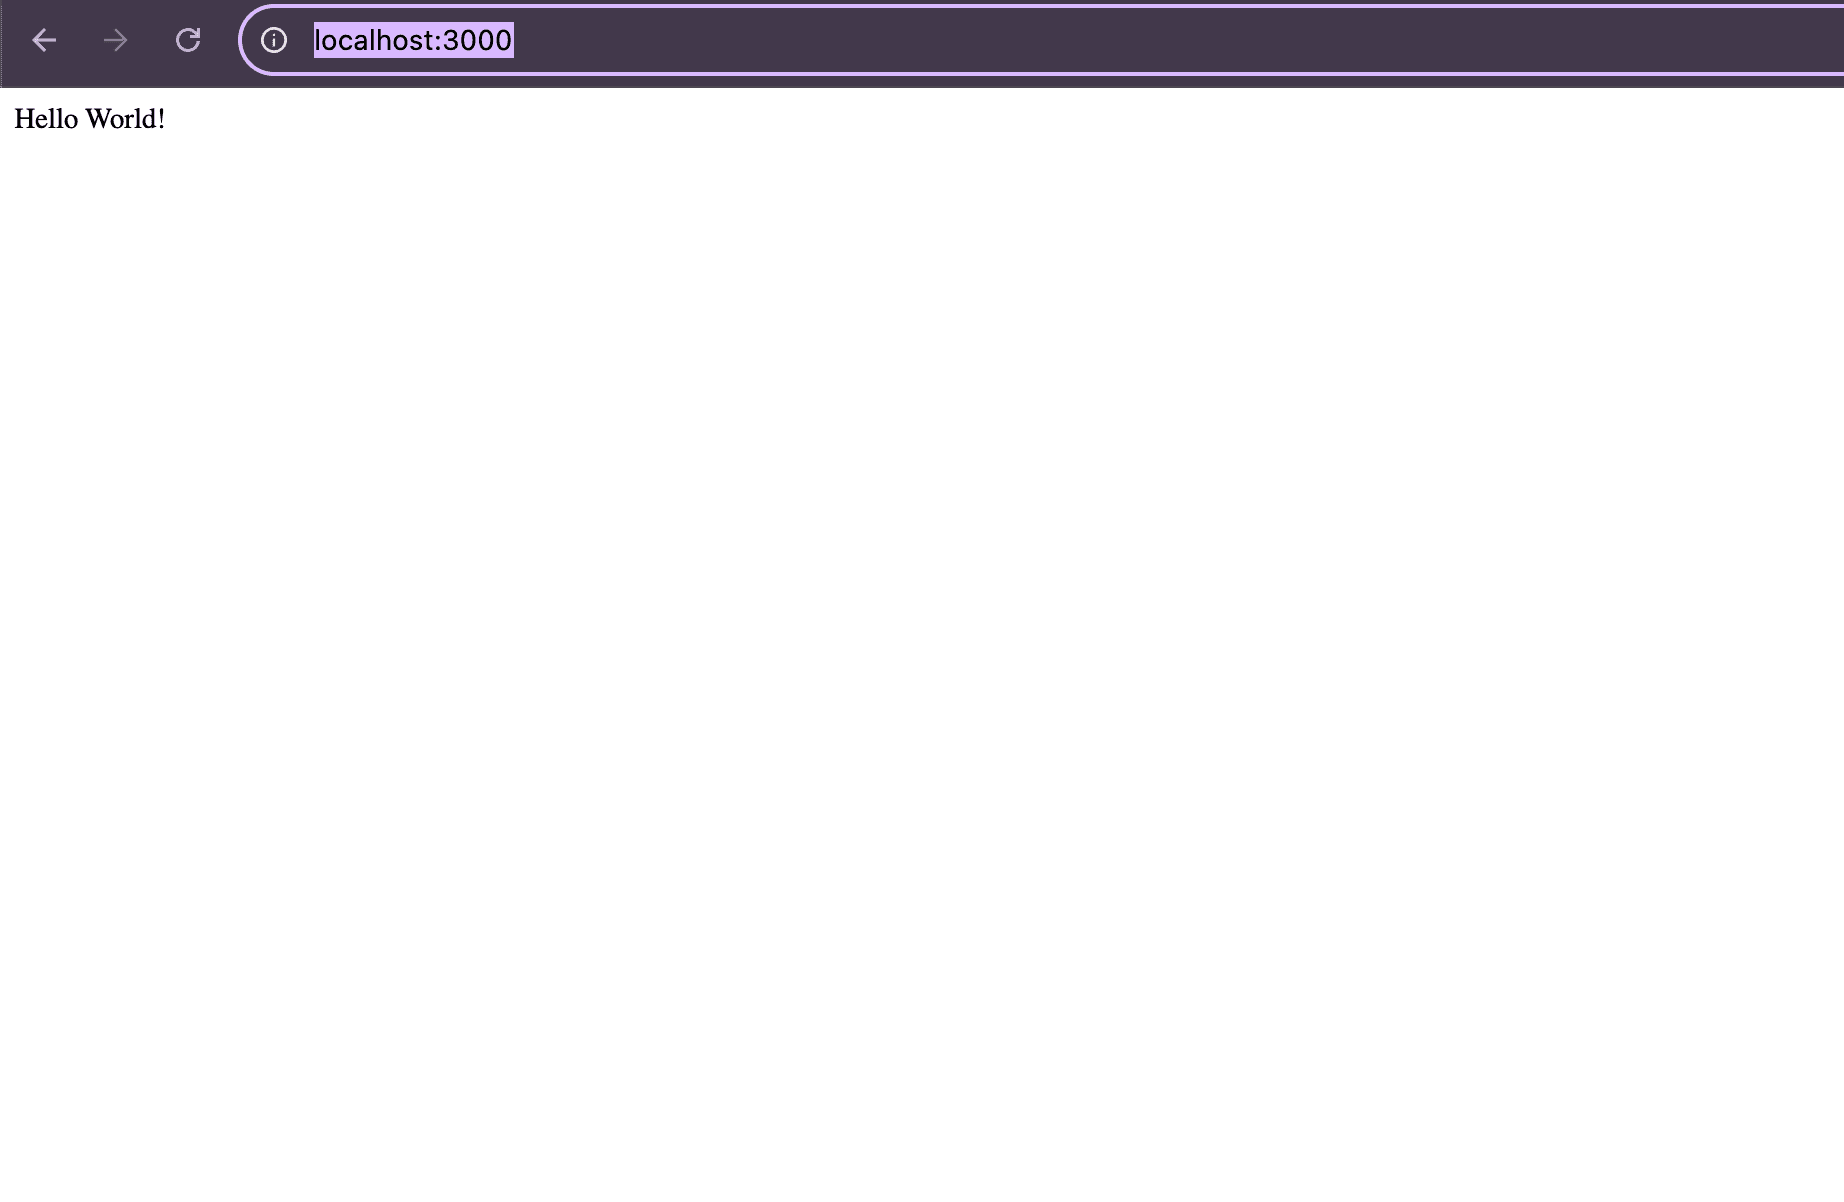
First, I got the Node.js server running and saw a Hello, World example in the browser. Next step, setting up Grafana and Prometheus.
I got Grafana up and running, and was able to set up the data source 😀
Okay, now I have everything running, and I can even see something in the graph. This means that everything I have done so far is working as expected.
I think that this was a good intro to the monitoring part. Now let’s try to do something similar for the logging part. Because to become a DevOps, you need to know both of these subjects.
Hands-on experience with logging
>>> Can you build in this example we have gone through, and give me a hands-on task for getting started with logging?

Certainly! Building on the previous example where we set up monitoring with Prometheus and Grafana, we can now add logging to our Dockerized application using the ELK Stack (Elasticsearch, Logstash, and Kibana). This will help you understand how to collect, process, and visualize logs from a Dockerized application.

### Task: Set Up Logging for a Dockerized Application with the ELK Stack

#### Prerequisites

• Docker and Docker Compose installed on your machine.
• Basic understanding of Docker and containerization.

#### Step 1: Set Up the ELK Stack

1. Create a Docker Compose file to set up Elasticsearch, Logstash, and Kibana.
# docker-compose.yml
version: '3.7'

services:
  elasticsearch:
    image: docker.elastic.co/elasticsearch/elasticsearch:7.10.1
    environment:
      - discovery.type=single-node
    ports:
      - "9200:9200"

  logstash:
    image: docker.elastic.co/logstash/logstash:7.10.1
    volumes:
      - ./logstash.conf:/usr/share/logstash/pipeline/logstash.conf
    ports:
      - "5044:5044"

  kibana:
    image: docker.elastic.co/kibana/kibana:7.10.1
    ports:
      - "5601:5601"

2. Create a Logstash configuration file ( logstash.conf ) to process logs.
# logstash.conf
input {
  beats {
    port => 5044
  }
}

output {
  elasticsearch {
    hosts => ["http://elasticsearch:9200"]
    index => "docker-logs-%{+YYYY.MM.dd}"
  }
}


#### Step 2: Set Up Filebeat

1. Create a Filebeat configuration file ( filebeat.yml ) to ship logs from the Docker container to Logstash.
# filebeat.yml
filebeat.inputs:
- type: container
  paths:
    - /var/lib/docker/containers/*/*.log

output.logstash:
  hosts: ["logstash:5044"]

2. Add Filebeat to the Docker Compose file:
filebeat:
  image: docker.elastic.co/beats/filebeat:7.10.1
  volumes:
    - /var/lib/docker/containers:/var/lib/docker/containers:ro
    - ./filebeat.yml:/usr/share/filebeat/filebeat.yml
  depends_on:
    - logstash


#### Step 3: Run the ELK Stack

1. Start the ELK Stack:
docker-compose up -d

2. Verify the Setup:
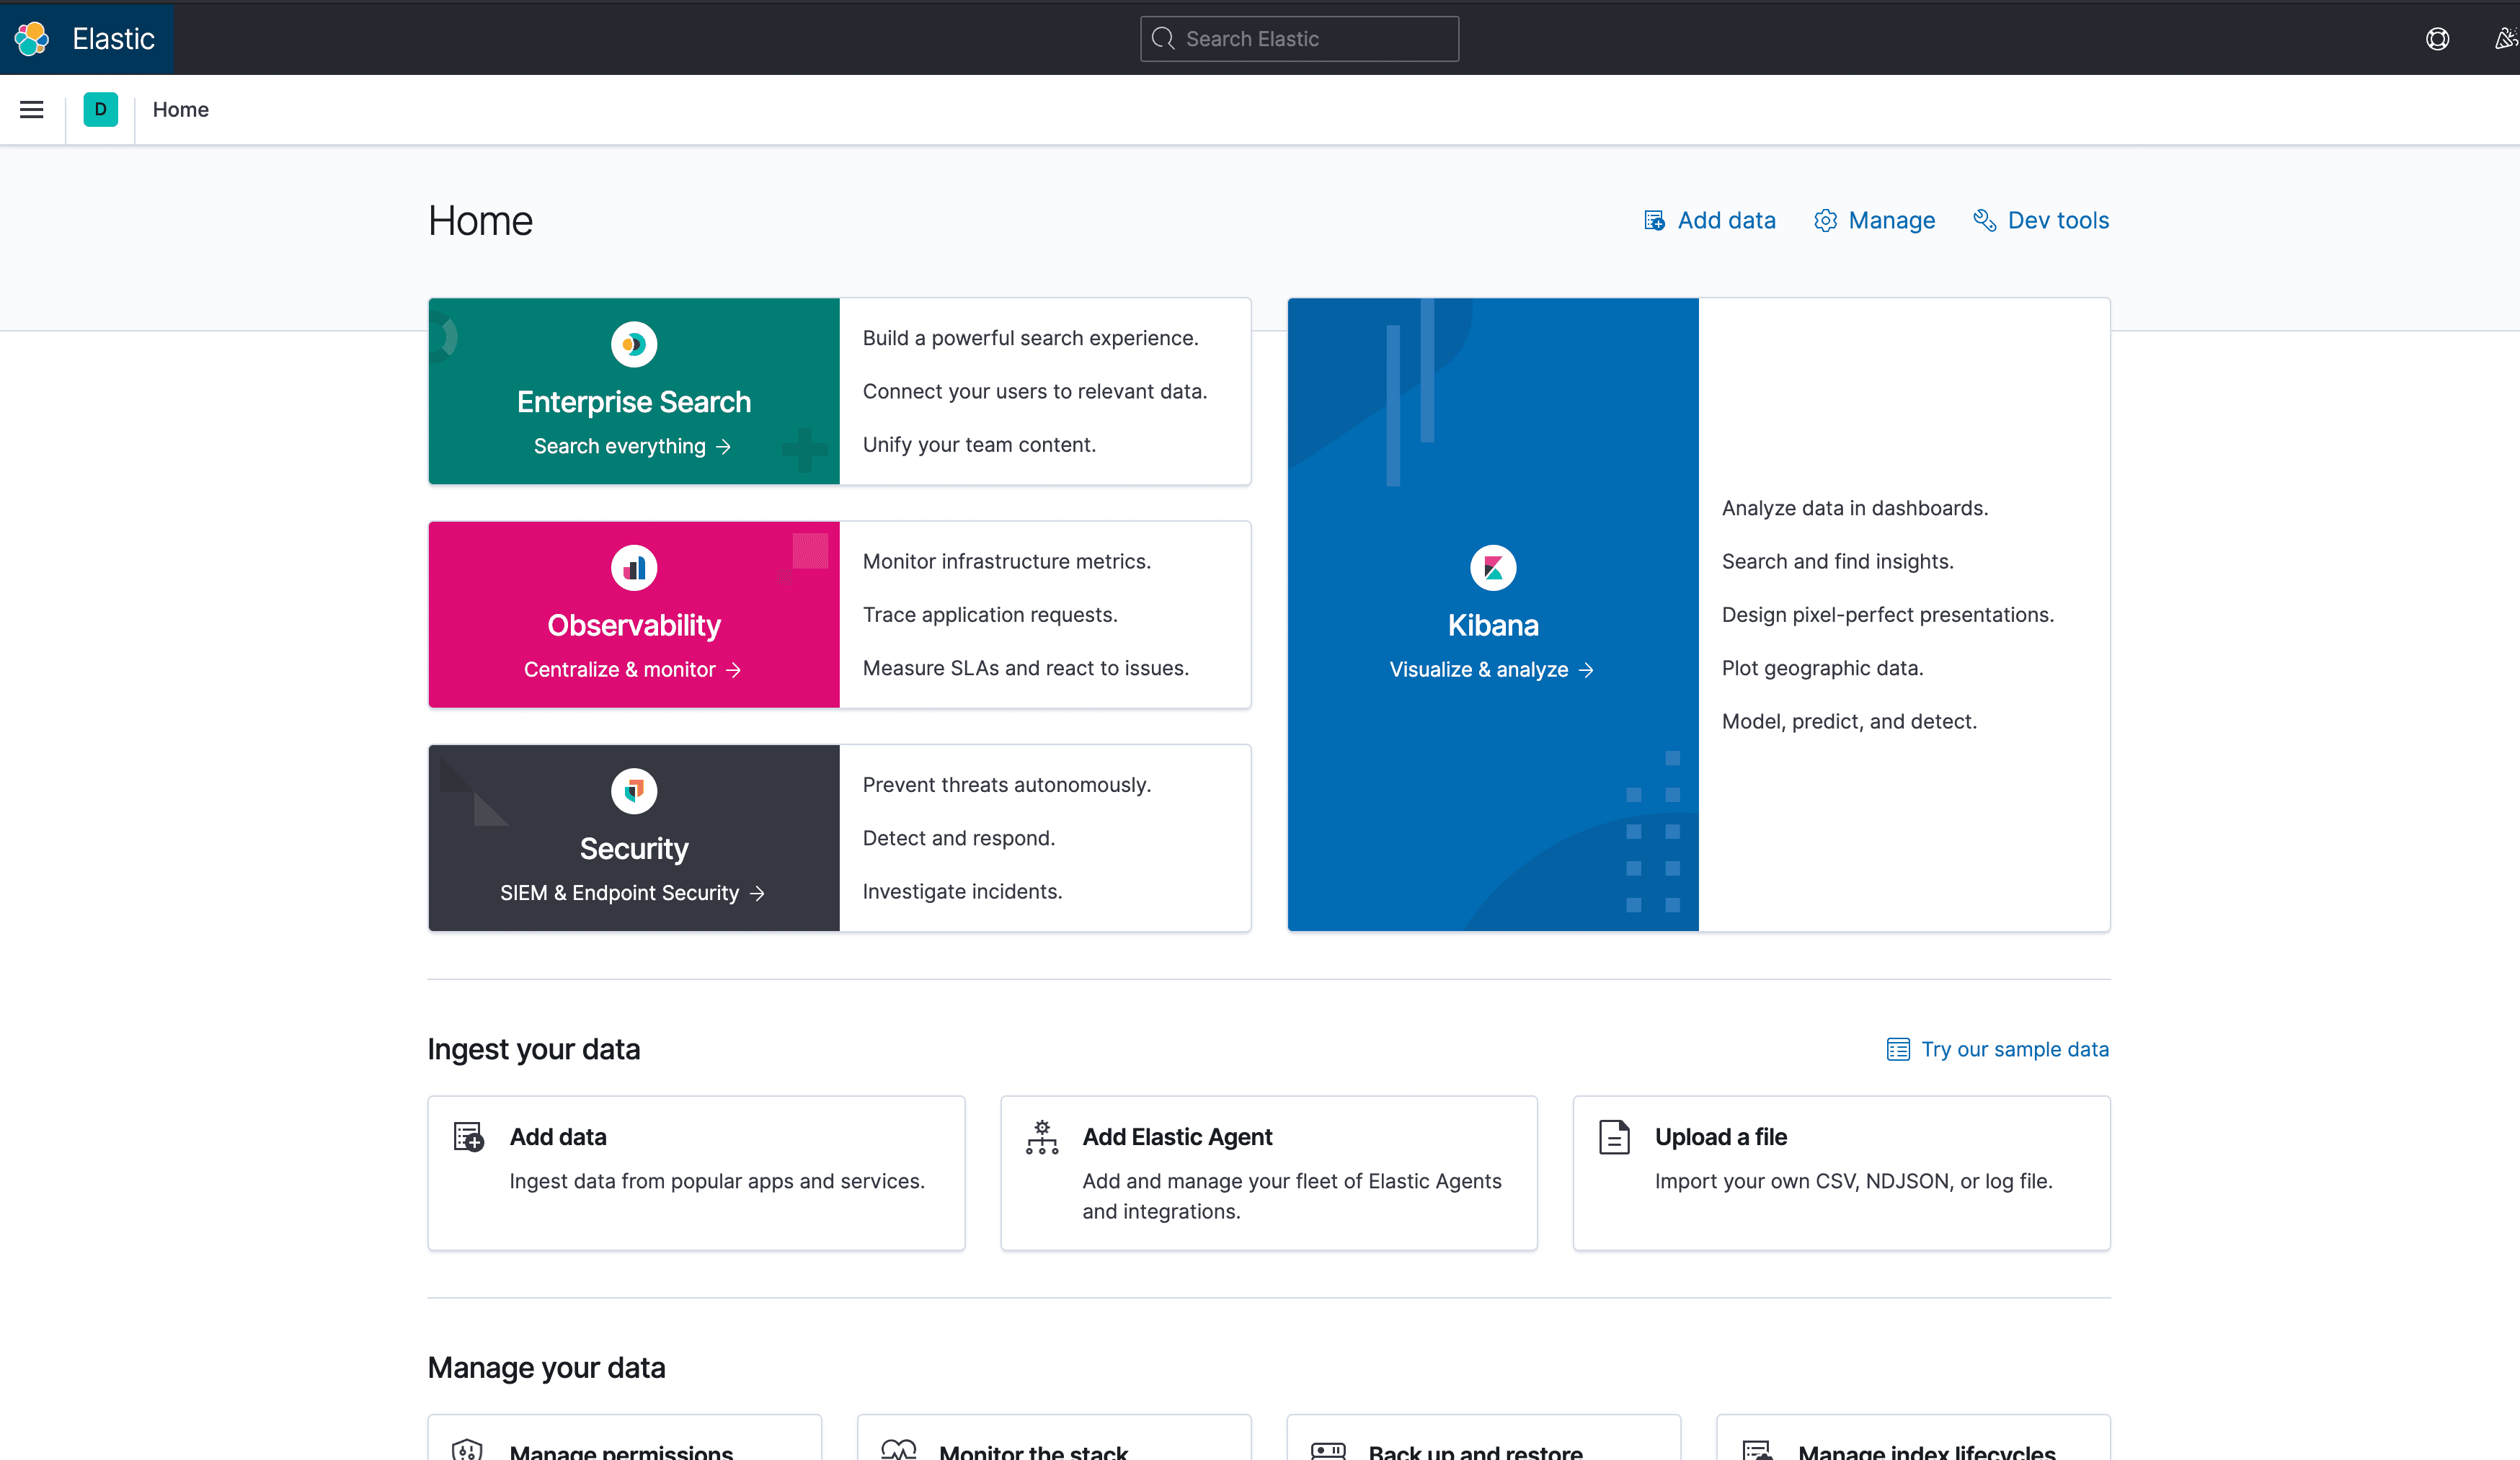
• Access Kibana by navigating to  http://localhost:5601  in your web browser.
• Go to "Discover" to see the logs being collected from your Dockerized application.


#### Step 4: Generate Logs

1. Run the Node.js Application:
• Ensure your Node.js application is running and generating logs.
2. Check the Logs in Kibana:
• Use Kibana's search and filter capabilities to explore the logs and gain insights into your application's behavior.


### Conclusion

You now have a basic logging setup with the ELK Stack collecting logs from a Dockerized Node.js application. This setup can be expanded by adding more log sources, creating custom dashboards in Kibana, and setting up alerts for specific log patterns.

If you have any questions or need further assistance, feel free to ask!
So, I got most of this running 🙂
But still there was some sort of problem I couldn’t figure out by my own or by the help from Clio. Sometimes, the scripts that Clio is able to provide can be too old and similar which can lead to things not working as expected.
I should maybe give this thing one more try to see if it’s working, start all over and try again.
Summary
In this part we started out by learning a bit more about what monitoring and logging means to a DevOps. After that, we had some hands on experience with both monitoring and logging.
It’s nice to see how we can use Docker which we already learned about previously in this series. And since I already had learned a little bit, I understood everything in the Docker scripts, where to put the files, etc.
In the next and last part of this series, we will learn about security.


